Contact Mechanics & Seal Theory
Persson & Yang Leak Rate Simulator
An independent recreation of Persson & Yang's (2008) contact mechanics and seal leak-rate theory, built entirely from primary academic literature. No coursework, no guidance, just the paper and related textbooks. The underlying physics spans fractal surface statistics, contact mechanics, and percolation theory. Graduate-level material, self-taught from scratch and implemented in full in MATLAB and Python.
Built entirely on personal time. The model uses a fractal surface power spectral density (PSD) and a percolation threshold criterion. When the real contact area drops below ~40% of nominal, a connected gap path forms across the seal and leakage begins. Applied here to a rubber seal squeezed against a rough substrate, with results scaled to the full seal contact length.
Surface Resolution Animation
Fig. 14 — Persson & Yang (2008)As the zoom parameter ζ steps from 1 to its Nyquist limit, progressively finer roughness wavelengths are resolved. At each frame Persson's theory predicts the real contact area fraction A/A₀. The percolation threshold — where A/A₀ ≈ 0.4 — marks the first frame at which a connected gap path spans the seal width. Black = contact | White = gap.
Binary contact map · ζ = 1 → Nyquist · Persson & Yang (2008) · click to enlarge
Filtered surface mesh (left) & binary contact map (right) · click to enlarge
Theory Predictions — Figs. 6–11
Reproduced from Persson & Yang (2008)Critical constriction wavelength λc, gap thickness uc, and leak rate Q̇ versus squeezing pressure at the percolation onset (A/A₀ = 40%), for two independent sweeps. Click any plot to enlarge.
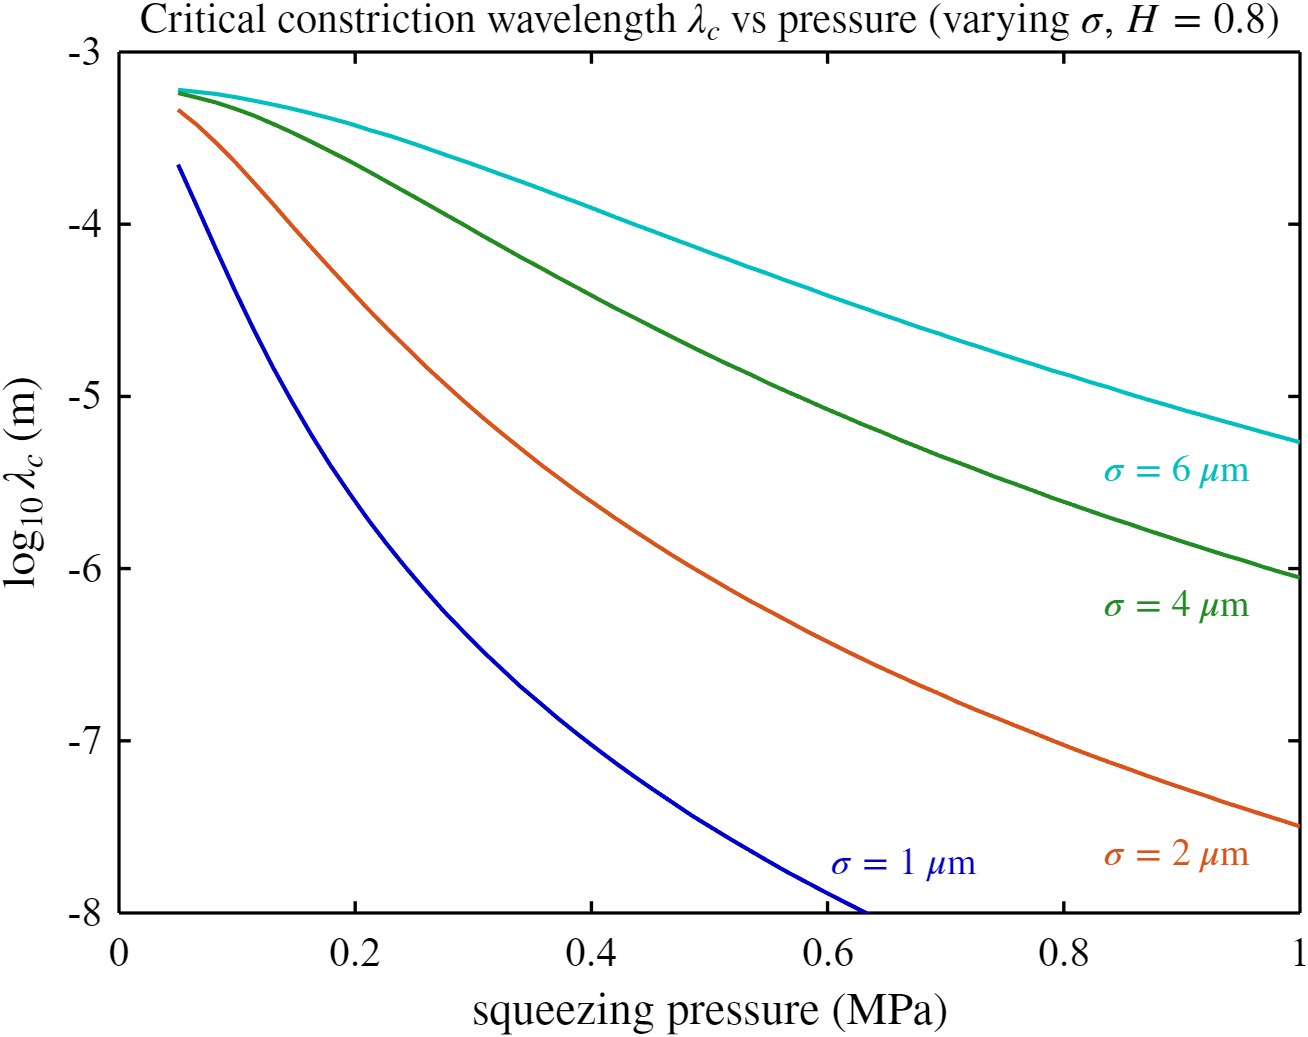 Fig. 6 — Critical wavelength λc vs squeezing pressure. Higher roughness σ shifts the percolation onset to shorter wavelengths at a given pressure — the seal must be loaded harder to close off the dominant gap channels.
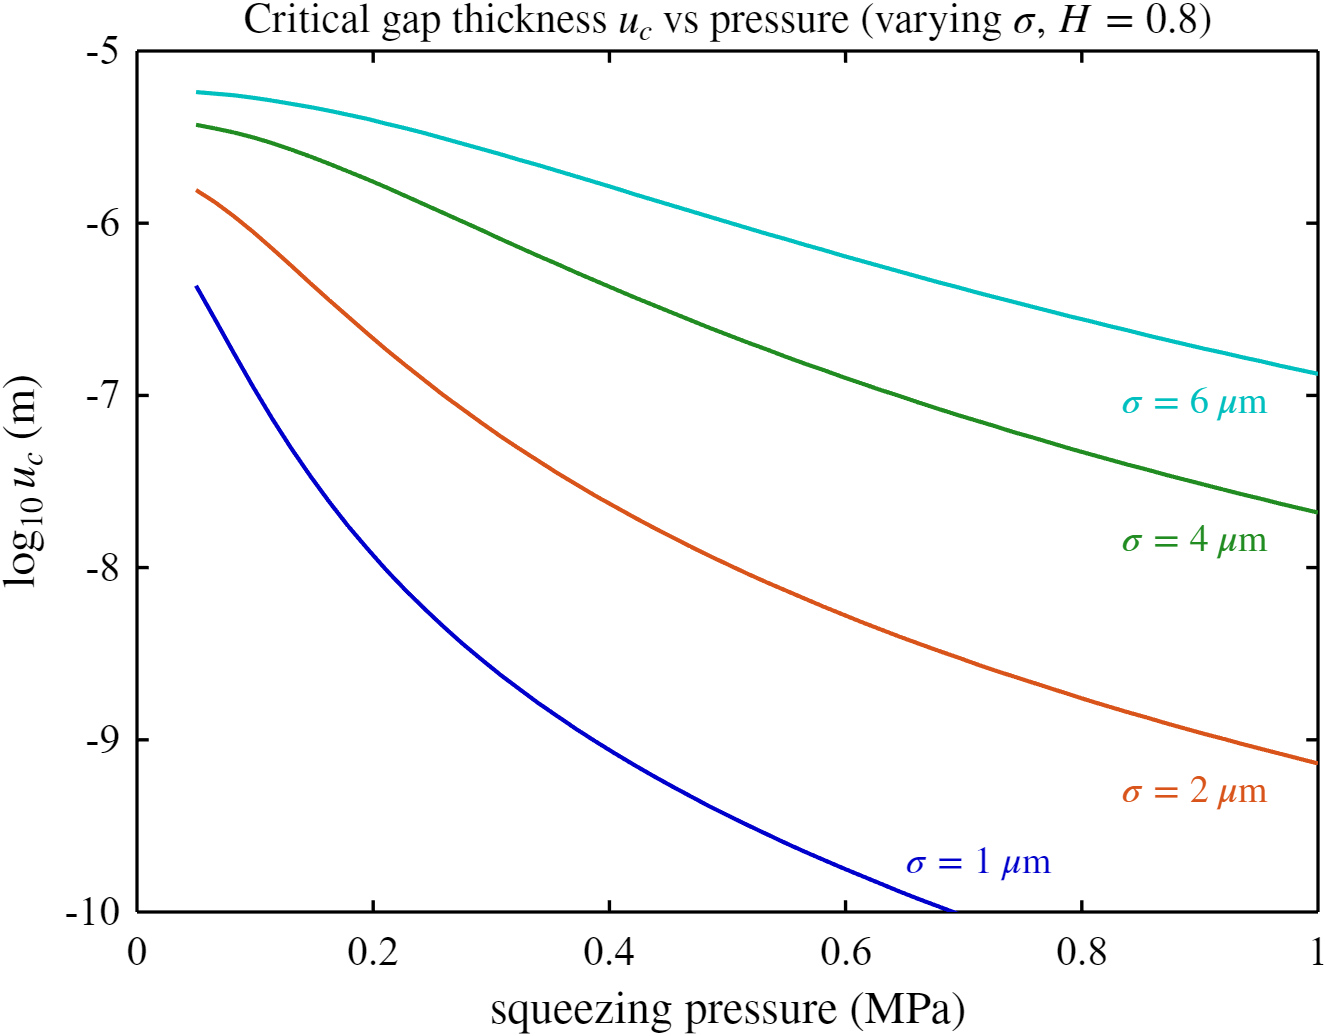 Fig. 7 — Critical gap thickness uc vs pressure. Rougher surfaces allow a larger mean opening before the contact area drops to the percolation threshold — more roughness means more gap volume at onset.
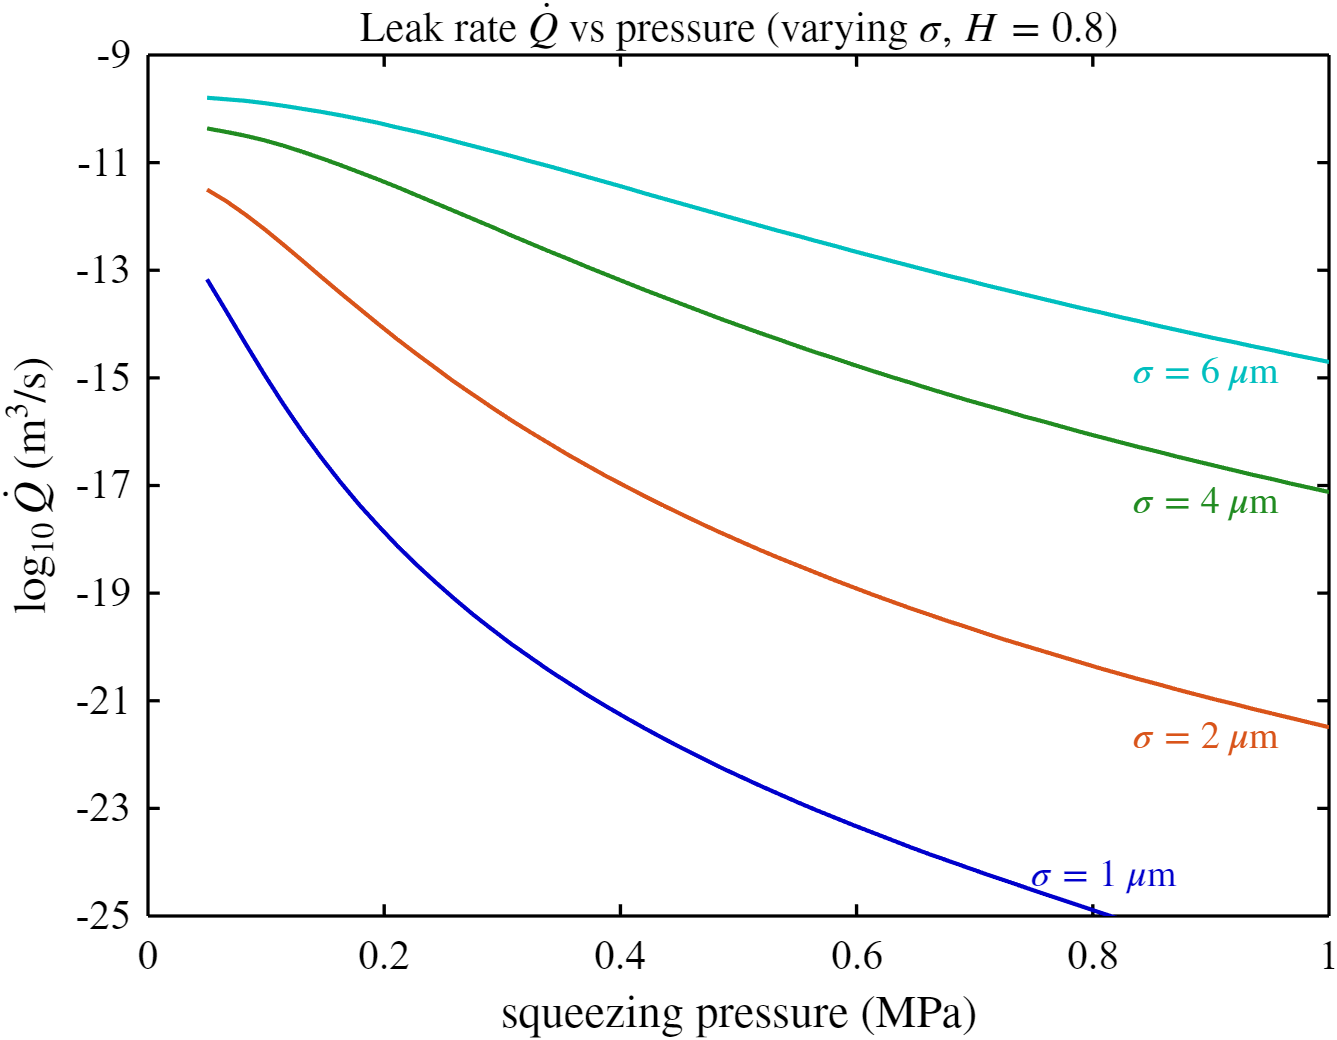 Fig. 8 — Leak rate Q̇ vs squeezing pressure. The pressure dependence reflects the uc³ term in the Poiseuille flow equation — a 10× change in gap thickness means 1000× change in flow rate.
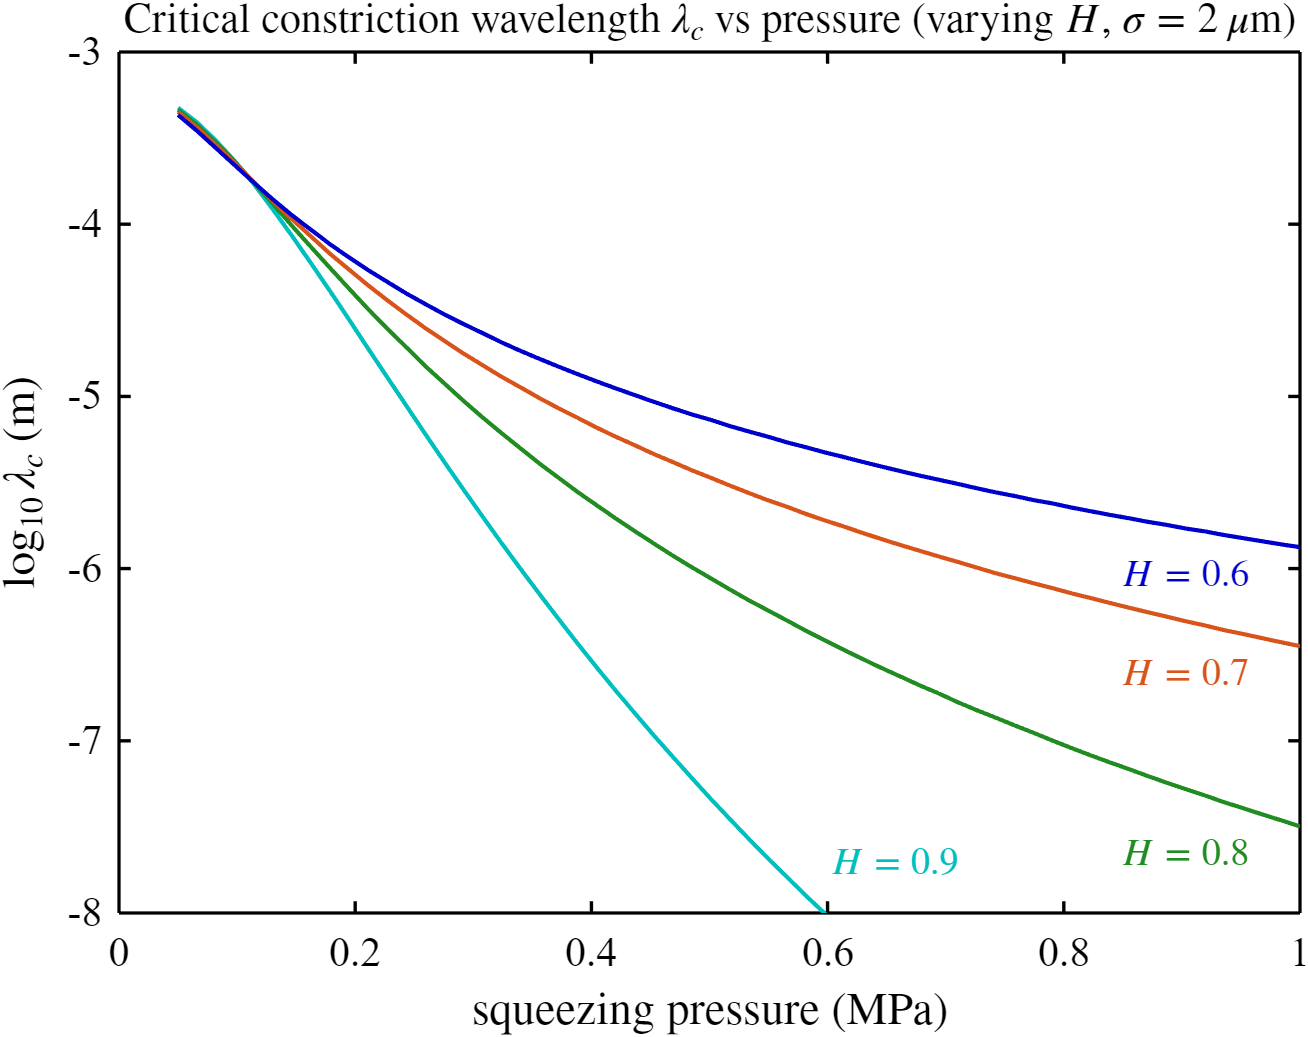 Fig. 9 — λc vs pressure, varying Hurst exponent H. H controls the fractal dimension of the roughness spectrum — higher H (smoother long-range structure) shifts the critical wavelength curve downward.
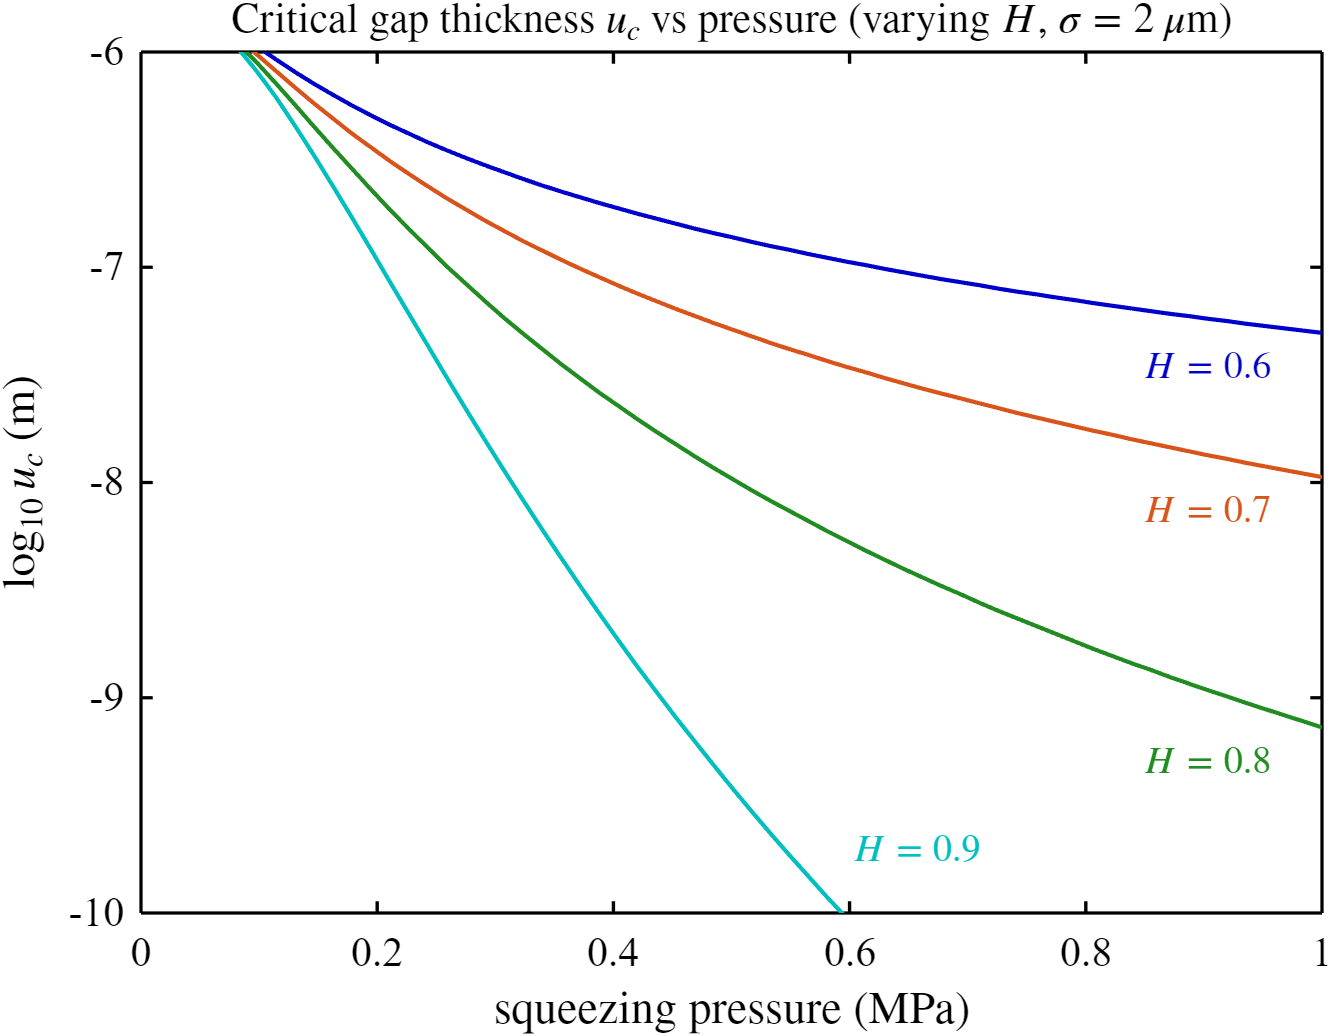 Fig. 10 — uc vs pressure. The Hurst exponent governs how energy is distributed across length scales in the PSD — lower H means more fine-scale roughness and a larger gap at onset.
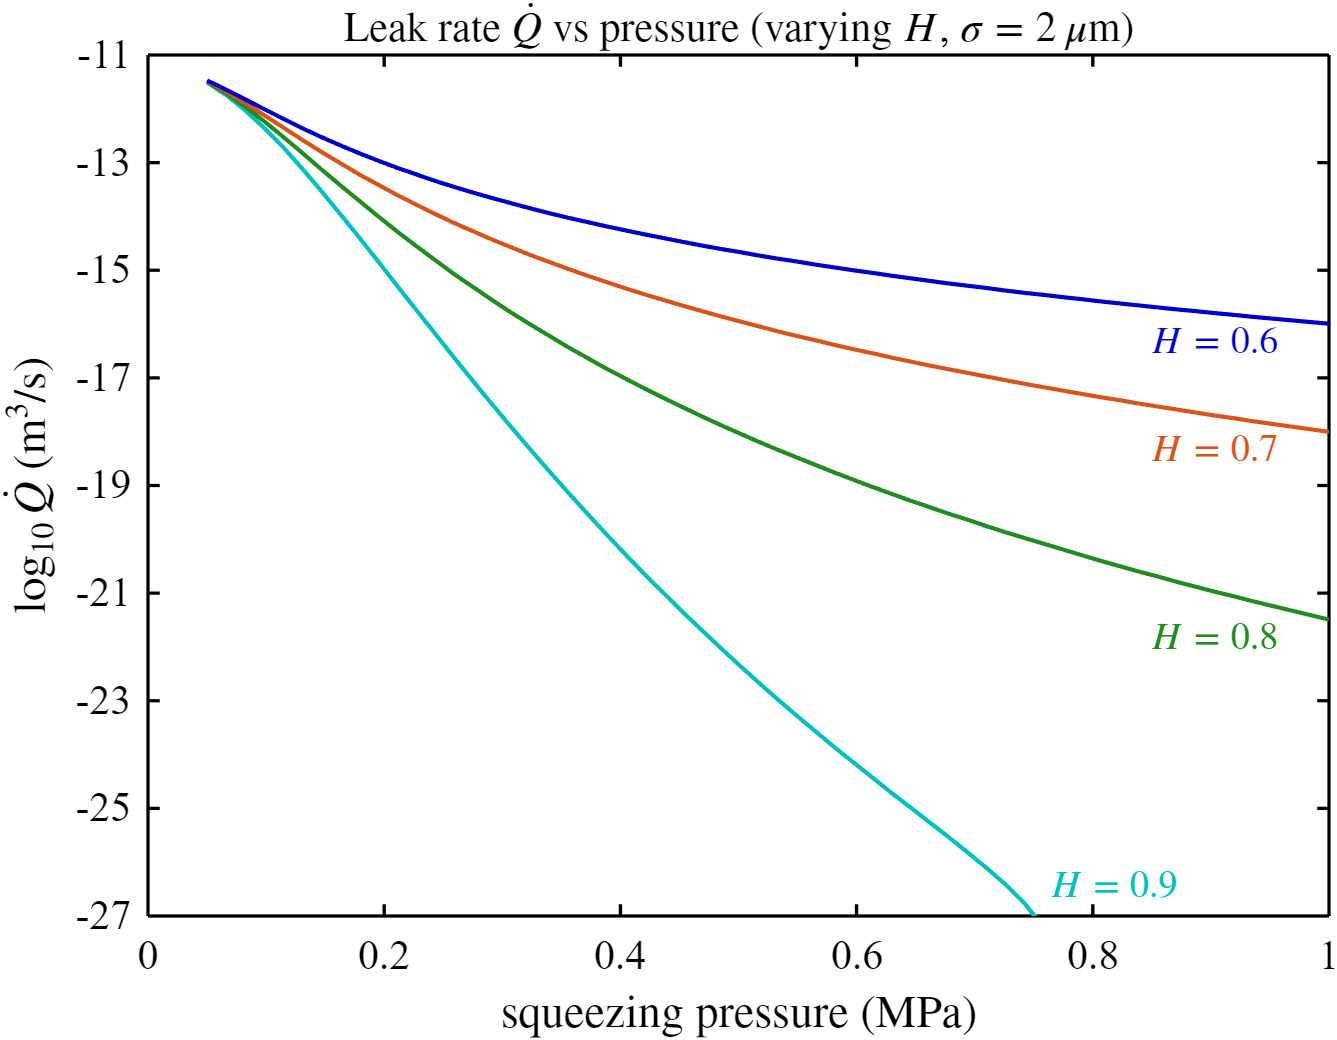 Fig. 11 — Q̇ vs pressure. Surfaces with lower H (rougher fine-scale structure) produce higher leak rates at the same macroscopic squeezing pressure — and the spread across curves widens dramatically at low pressures.
Applied Example: Rubber Seal on a Rough Substrate
Surface roughness · squeezing force · pressure differenceThe theory was applied to a rubber seal (E = 10 MPa) squeezed against a rough substrate. Each surface roughness level n adds a fixed increment to the RMS roughness σ at the Hertz contact patch, reducing the contact area fraction and opening a percolation path.
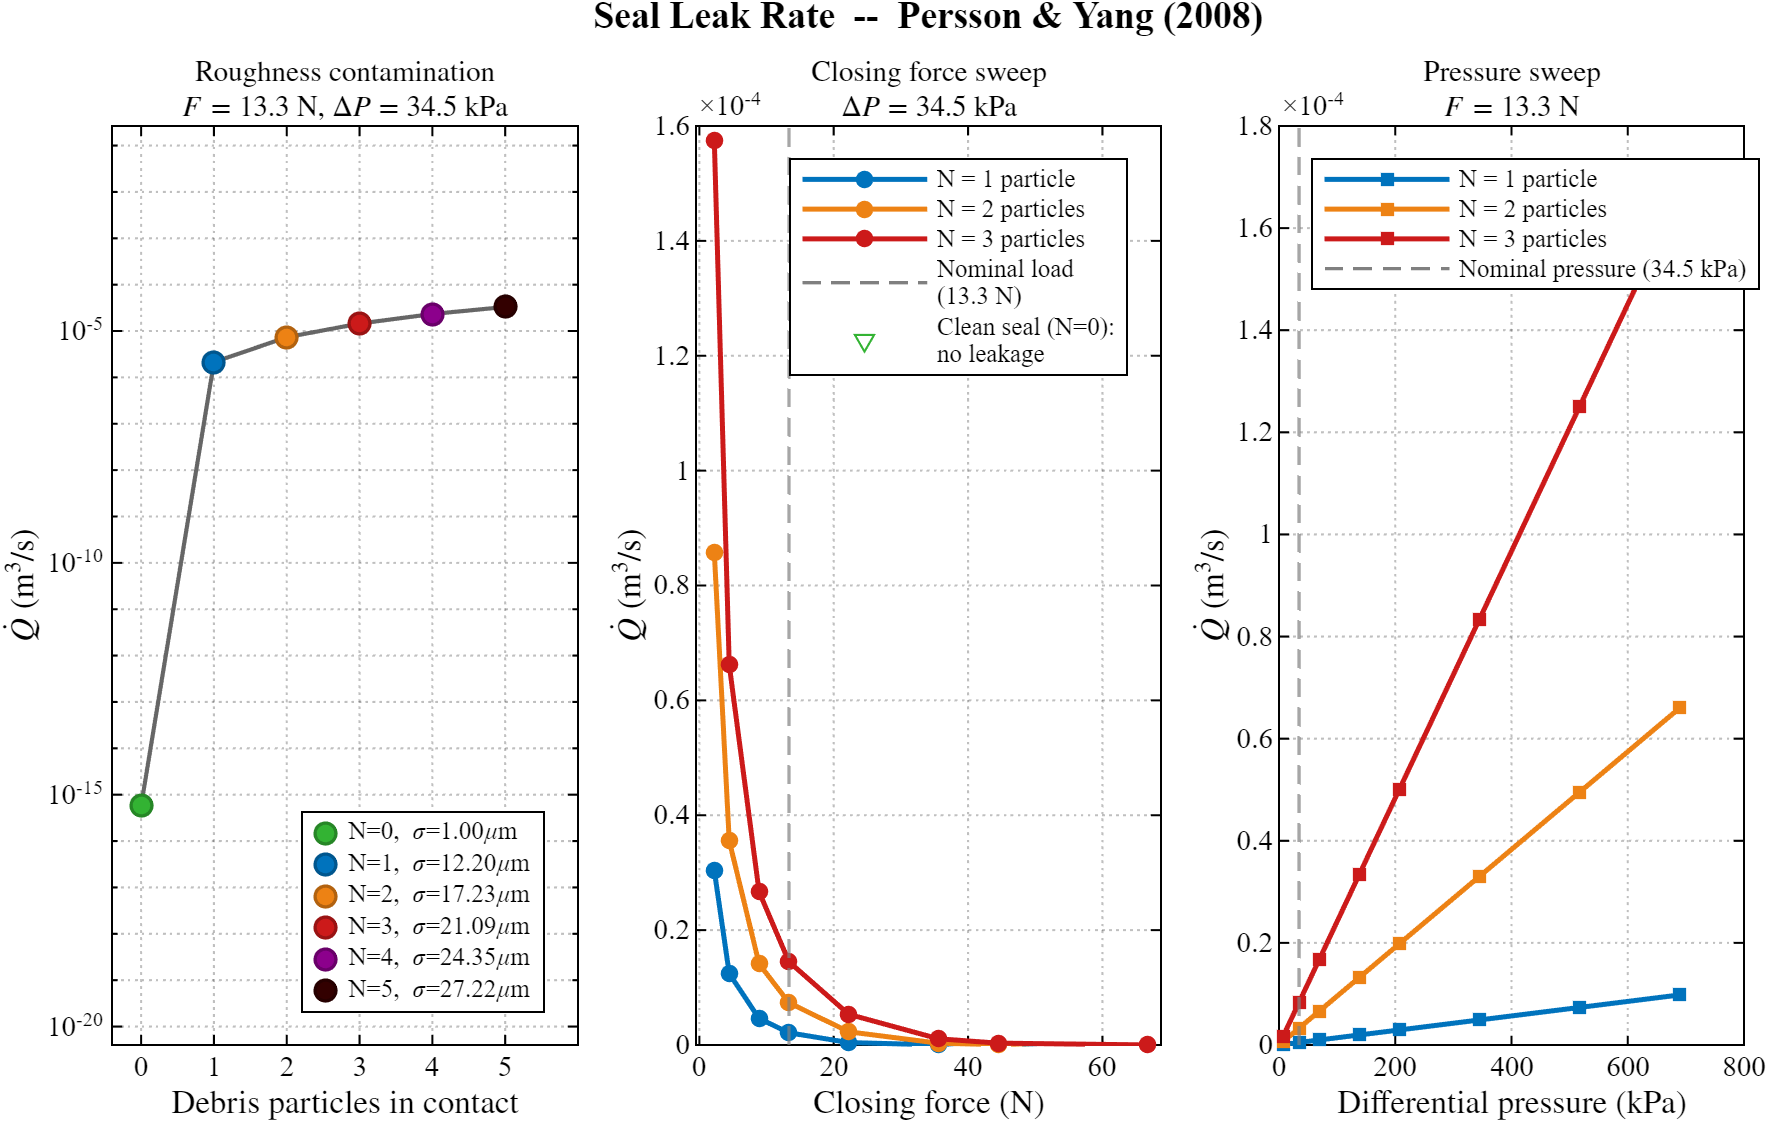 All three parameter sweeps on a common Q̇ (m³/s) axis. Left: surface roughness. Center: squeezing force. Right: fluid pressure difference. Full seal contact length scaling applied throughout.
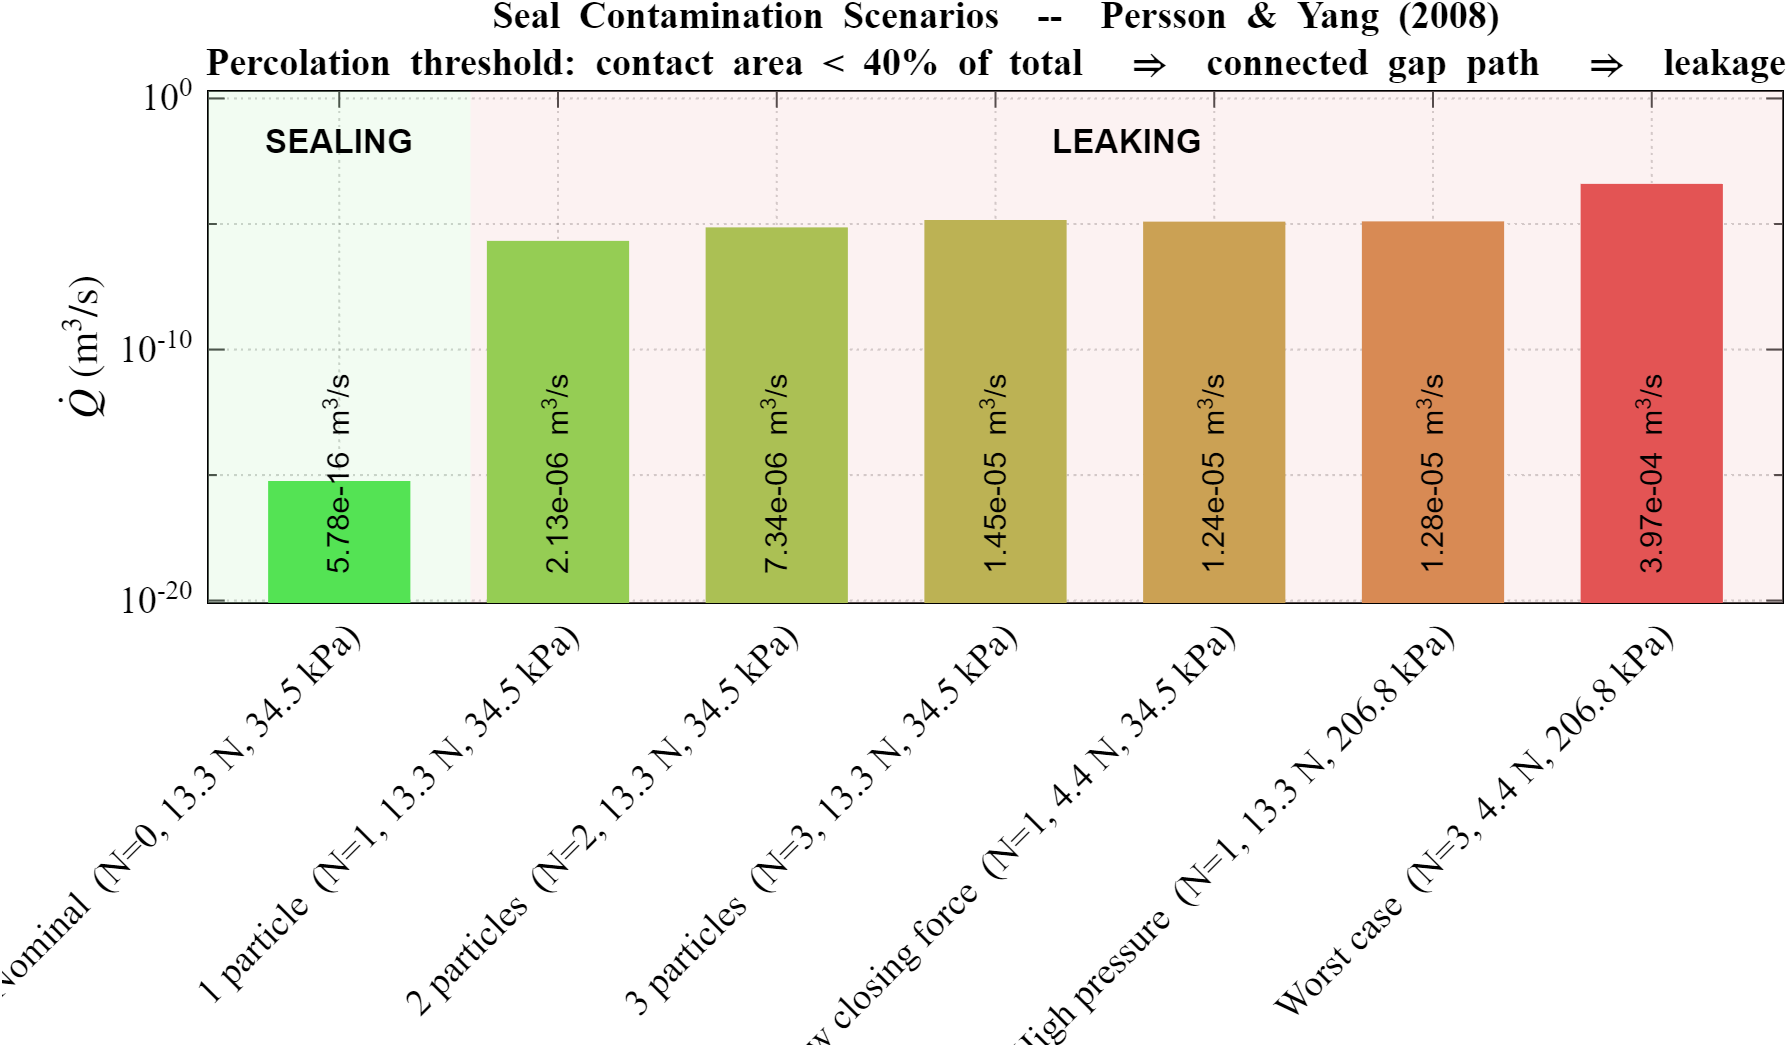 Scenario dashboard — seven operating conditions from baseline roughness (sealed, no percolation path) through the worst case (roughness level 3 + low squeezing force + high ΔP). Green zone: contact area above percolation threshold. Red zone: connected gap, active leakage.
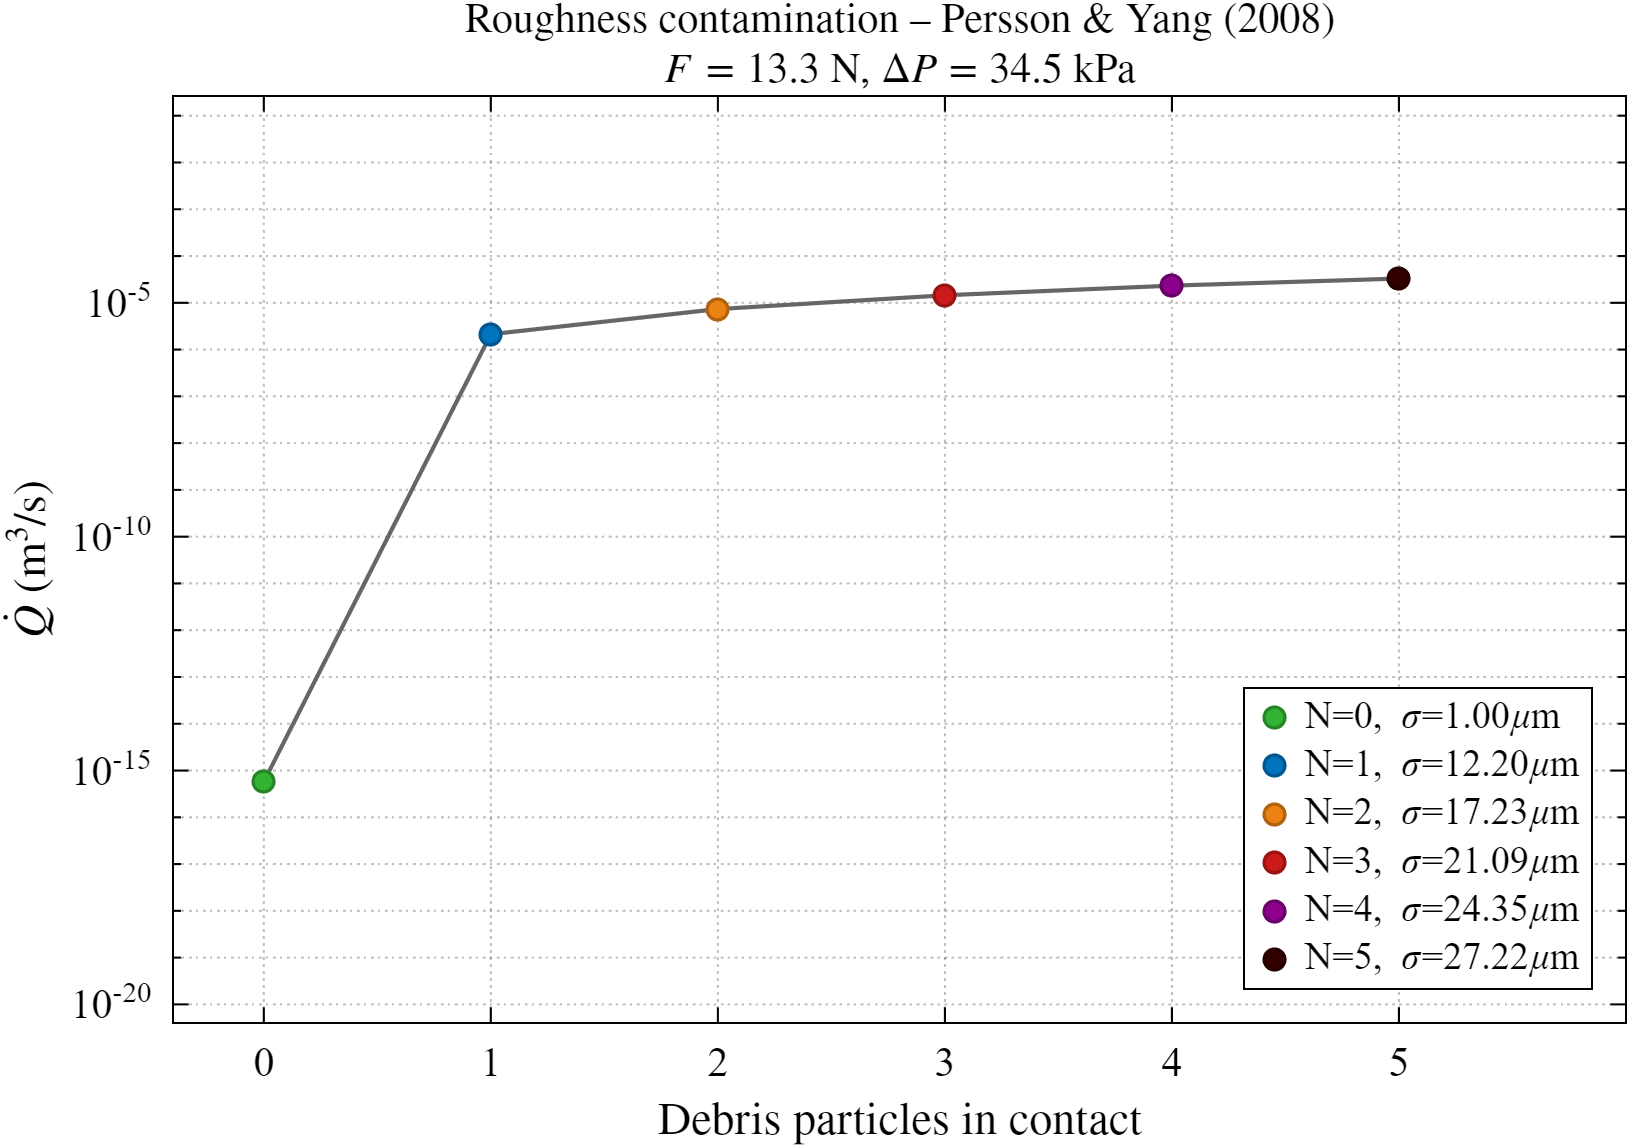 Surface roughness sweep (squeezing force = 13 N, ΔP = 35 kPa). At baseline roughness (n = 0) the seal holds — one roughness level is enough to open a percolation path. Each additional level raises σ and dramatically increases Q̇.
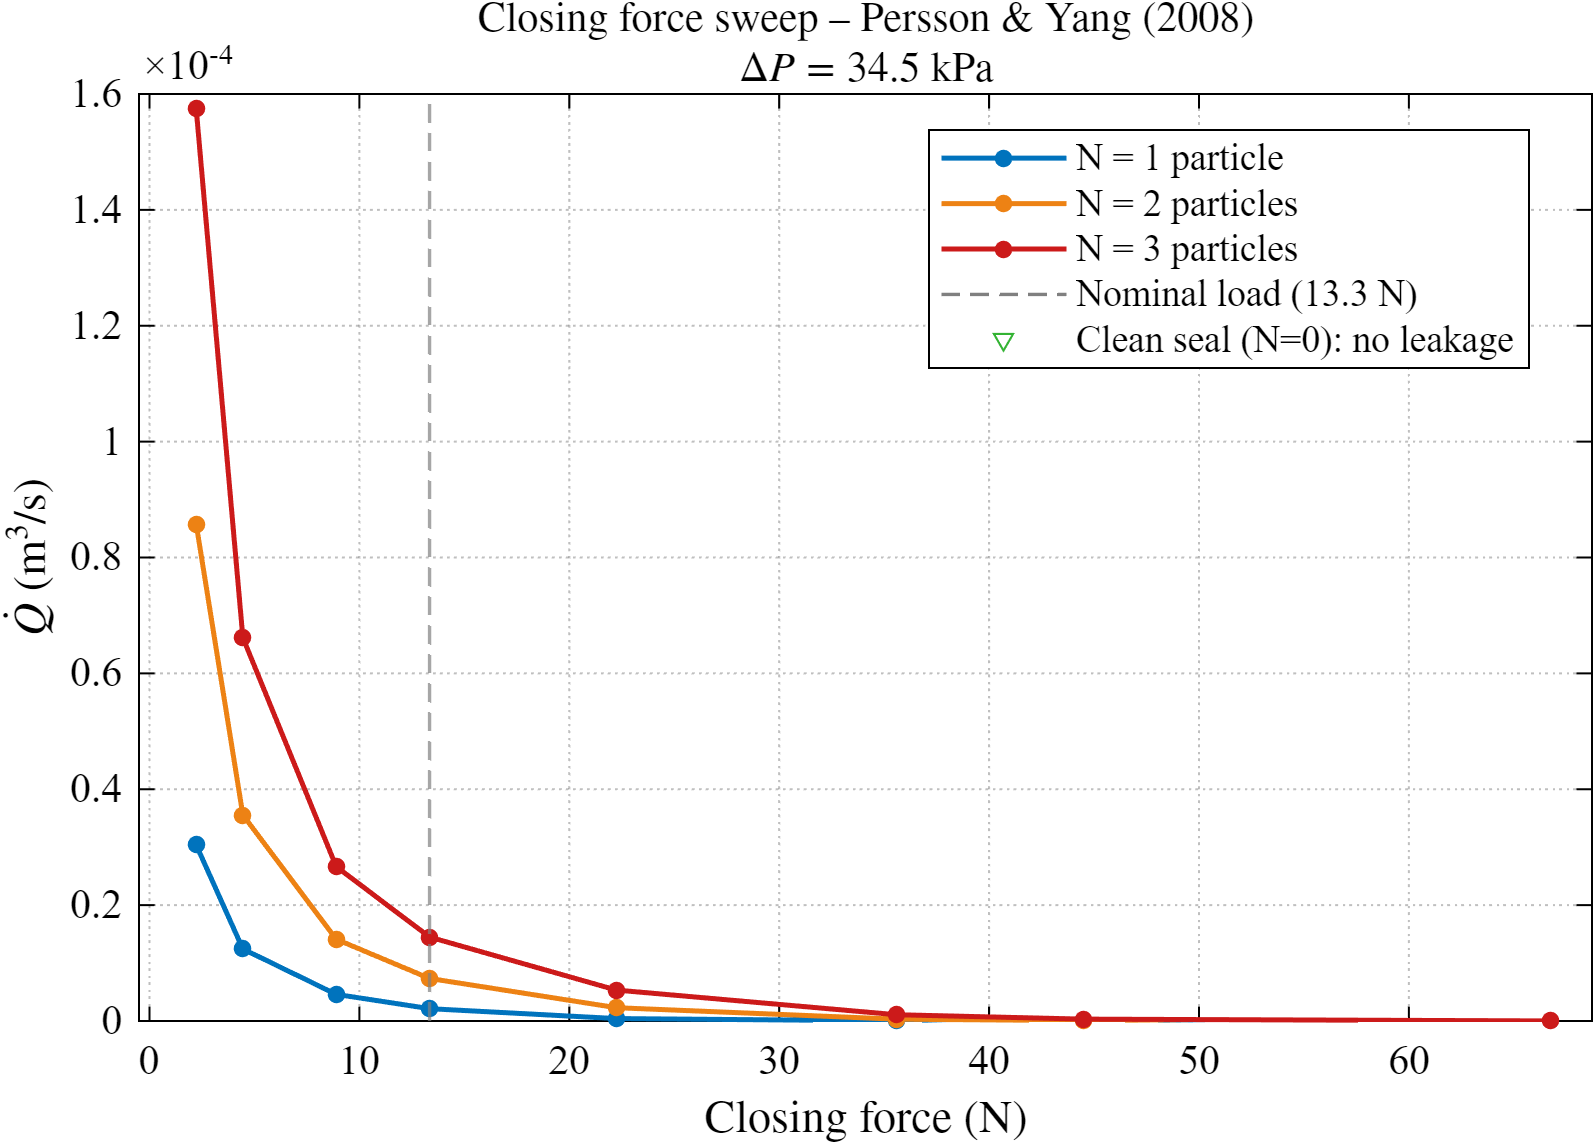 Squeezing force sweep (ΔP = 35 kPa, roughness levels 1–3). Higher squeezing force increases Hertz contact pressure and closes the gap — a practical mitigation for rougher surfaces. Nominal load at 13 N marked.
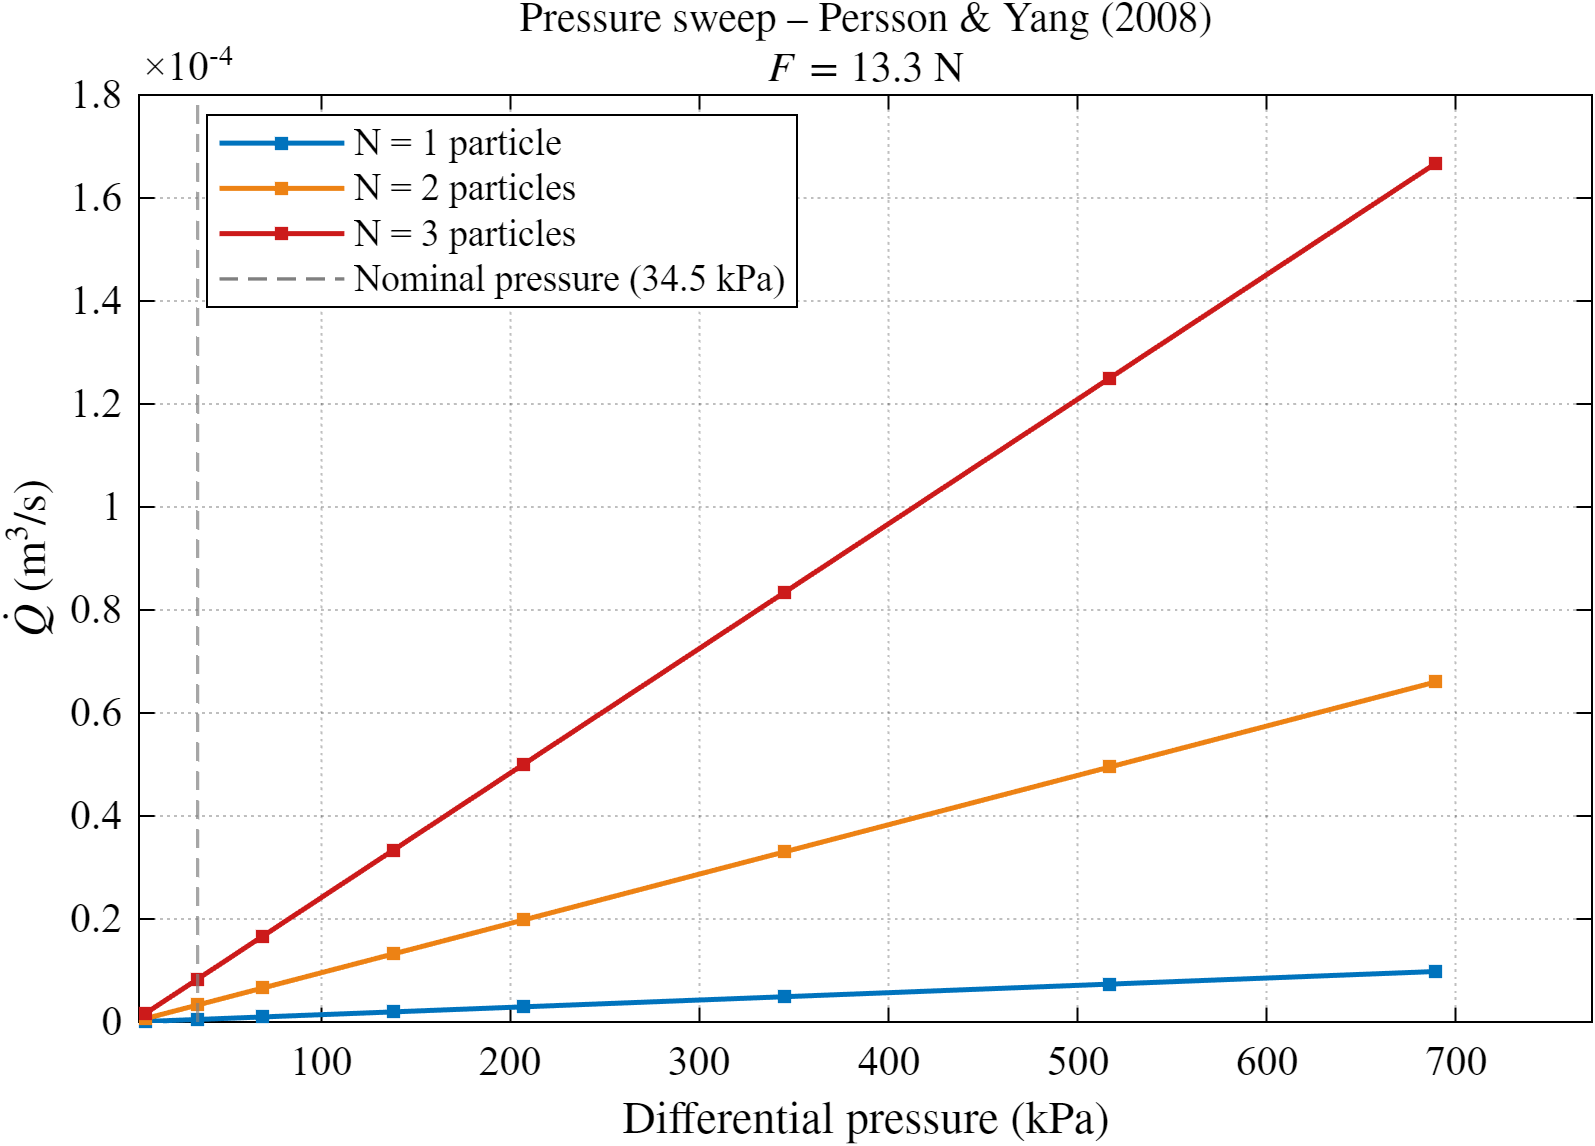 Pressure sweep (squeezing force = 13 N, roughness levels 1–3). Leak rate scales linearly with ΔP (Poiseuille regime). Nominal 35 kPa marked — note how high roughness at high pressure approaches the dashboard's worst-case scenarios.
Interactive Leak-Rate Calculator
Live simulation — self-hostedAdjust squeezing force, fluid pressure difference, and surface roughness — the Persson solver runs in real time and updates Q̇ in m³/s and mL/min. Built with Python + Streamlit, served directly from this server.
Numerical Results
m³/s · mL/minFull tabulated output for all three sweeps and the scenario dashboard, in SI units.
Loading…